Senior Living Workers Comp: The Injury Tax Nobody Budgets

The injury rate nobody wants to talk about
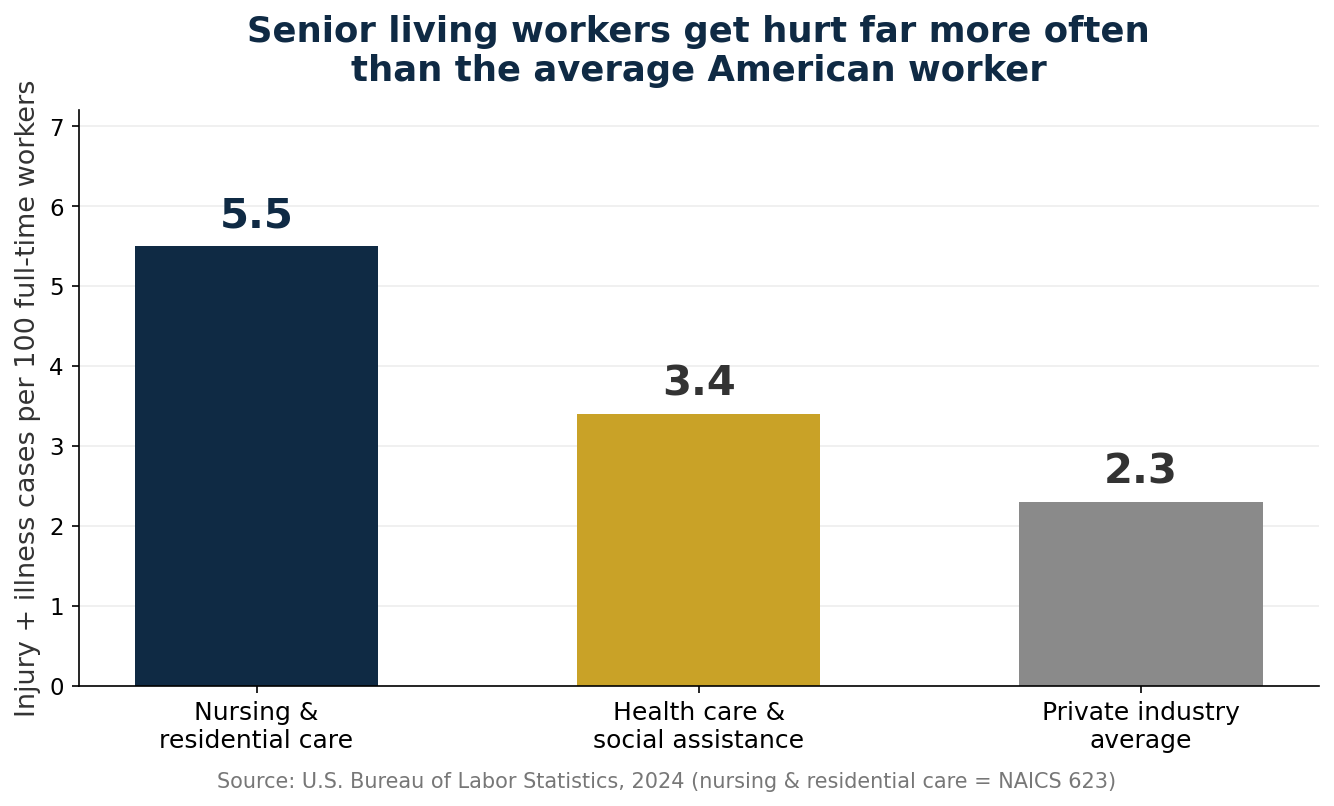
5.5.
That is the number of workplace injury and illness cases per 100 full-time workers that U.S. nursing and residential care facilities reported in 2024, per the Bureau of Labor Statistics.
The average across all private industry: 2.3.
Your caregivers get hurt at more than twice the rate of the average American worker. Not a little more. More than double. And 3.6 of those 5.5 cases per 100 workers involved days away from work, job restriction, or transfer. These are not paper cuts. These are lost-time events.
Here is the part nobody budgets for: those injuries do not just cost you medical bills and overtime. They reprice your workers comp premium for three years. Every claim lands on your experience modification, and the mod is a multiplier on your entire premium.
This is the injury tax. And most operators never see the bill itemized.
| Measure | Nursing & residential care | All private industry |
|---|---|---|
| Total recordable cases per 100 FTE | 5.5 | 2.3 |
| Cases with days away, restriction, or transfer | 3.6 | n/a |
| Cases with days away from work | 2.4 | n/a |
| Workplace fatalities (2024) | 30 | n/a |
Caregiving is physical work done by people who are tired, rushed, and often new. Resident transfers, repositioning, catching a falling resident, the 3 a.m. lift with nobody around to help. The exposure is built into the job.
And the cost of each claim keeps climbing. NCCI found that the average skilled nursing cost tied to a workers compensation claim rose from $14,700 in 2015 to $33,200 in 2024, outpacing inflation by wide margins since 2020. For accident year 2024, NCCI estimates claim frequency fell 6 percent while indemnity severity rose 5 percent and medical lost-time severity rose 6 percent. Fewer claims, more expensive ones.
Your turnover problem is a workers comp problem
Here is the statistic that connects your HR headaches to your insurance bill. The Workers Compensation Research Institute, in a report released this month, found that workers with less than two years on the job accounted for 54 percent of workers comp injuries from 2022 through 2024, despite making up roughly one third of the workforce. Nearly 40 percent of injuries happened in an employee’s first year. Sixteen percent happened in the first three months.
Now pair that with senior living’s staffing reality. SafelyYou’s 2026 research puts frontline and clinical turnover at 36 to 38 percent a year. Replacing one frontline caregiver costs about $7,160.
My read on what those two datasets mean together: a community turning over a third of its staff every year is running a permanent class of first-year employees, which is the exact population that produces more than half of all injuries. Turnover is not just a recruiting cost. It is a workers comp strategy, whether you meant it to be or not.
Every retained caregiver is two things at once: one less new hire in the danger zone, and one less $7,160 replacement to pay for. Retention is injury prevention with a paycheck attached.

The mod math, in dollars
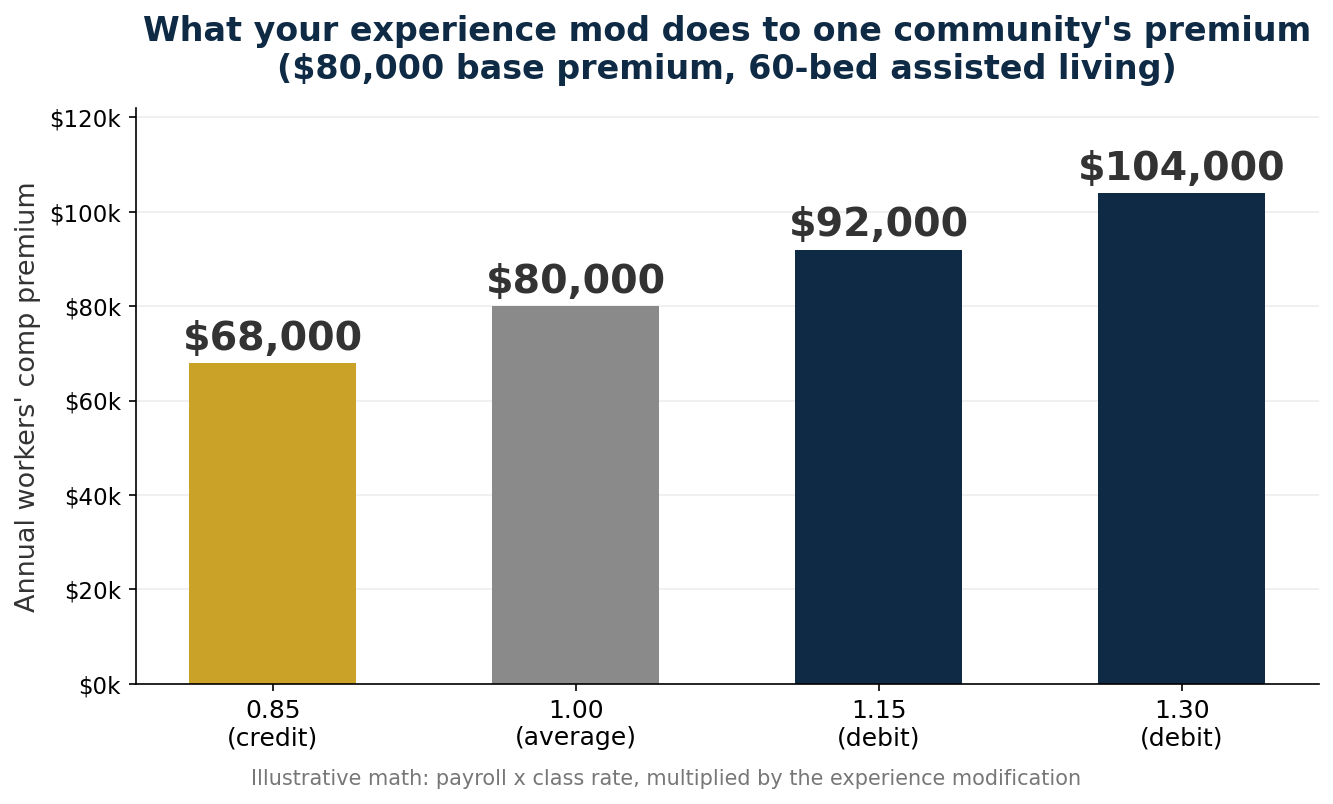
Your experience modification compares your actual loss history to what is expected for a business your size and type. A 1.00 means exactly average. Below 1.00, you get a credit. Above, a debit. It multiplies your whole premium.
Here is what that looks like on a 60-bed assisted living community with an $80,000 base workers comp premium:
| Experience mod | What it means | Annual premium |
|---|---|---|
| 0.85 | 15% credit, better than average | $68,000 |
| 1.00 | Average | $80,000 |
| 1.15 | 15% debit | $92,000 |
| 1.30 | 30% debit | $104,000 |
The swing from 0.85 to 1.30 is $36,000 a year, for the same payroll, the same building, the same coverage. And the mod runs on a rolling three-year window, so one bad year taxes you for three.
Two things about the formula matter more than most operators realize.
First, frequency hurts more than severity. NCCI splits every claim at a dollar threshold called the split point. The portion below it counts at full weight; the portion above it counts at reduced weight. The design is deliberate: a pattern of small claims predicts future trouble better than one freak large claim does. Ten $5,000 claims damage your mod more than a single $50,000 claim.
Second, the split point is no longer one national number. Since NCCI’s November 2023 overhaul, each state gets its own, from about $9,500 in Oregon to $38,000 in Louisiana. If you operate in multiple states, your mod is being calculated with different frequency thresholds in each one. Most operators have never checked.
What this does to your insurance
Your workers comp mod is one of the first numbers your underwriter looks at, and it colors everything else. A debit mod signals a safety problem, which makes the underwriter read your general liability and professional liability loss runs with more suspicion. A credit mod does the opposite: it tells the story of an operator who runs a tight building.
The mod also travels. Buyers look at it in acquisitions. It shows up in the same due diligence packet as your surveys and your occupancy. Like everything else in this business, the numbers that price your insurance are the numbers that price your company.

Your workers comp mod is a report card your underwriter reads before you walk in the room. The only question is whether you wrote it, or your injuries wrote it for you.
What best-in-class operators actually do
The operators with the lowest comp costs are not lucky. They run five disciplines:
- Protect the first 90 days. Sixteen percent of injuries happen in an employee’s first three months. No solo transfers until lift training is signed off. Pair every new caregiver with a veteran for the first month. The WCRI data says the first 90 days are the most dangerous period of employment. Treat them that way.
- Run a real return-to-work program. Every day an injured worker sits home, indemnity costs compound. Light duty, modified schedules, genuine transitional roles. The operators who bring people back fast keep claims medical-only, and medical-only claims barely move the mod.
- Manage frequency, not just severity. Audit your mod worksheet every year. About one in four contains an error that inflates the mod, per industry reviews. Challenge misclassified payroll, verify claim reserves on open files, and close stale claims that are still carrying reserves into your three-year window.
- Tie retention to safety spending. Do the math out loud: one prevented lost-time claim is worth multiples of a retention bonus, a lift-team stipend, or better shoes. When the CFO asks what the safety budget buys, the answer is a number, not a feeling.
- Build the renewal file before renewal. Four quarters of declining incident rates, documented post-injury reviews, signed training records, return-to-work outcomes. Hand your underwriter a trend line instead of a pile of loss runs. Start the file now; spend it at renewal.
Injuries will never go to zero. Caregiving is physical work, and acuity keeps rising. But the operators who manage workers comp like the six-figure line item it is, instead of treating it as a fixed cost, keep more margin and pay less for insurance.
When your underwriter asks about your mod, have an answer with a number in it. Better yet, have a trend line.
Sources: U.S. Bureau of Labor Statistics, 2024 injury and illness data for nursing and residential care facilities (NAICS 623); Workers Compensation Research Institute via Business Insurance, October 2026; NCCI skilled nursing claim cost data via McKnight’s Long-Term Care News; NCCI experience rating split point changes via JenCap; NCCI State of the Line data via Insurance Business; SafelyYou 2026 Cost of Senior Care report.