The Echo Assurance Senior Living Insurance Benchmark Report
2026 Edition
Echo Assurance: Senior Living Risk and Capital Advisor
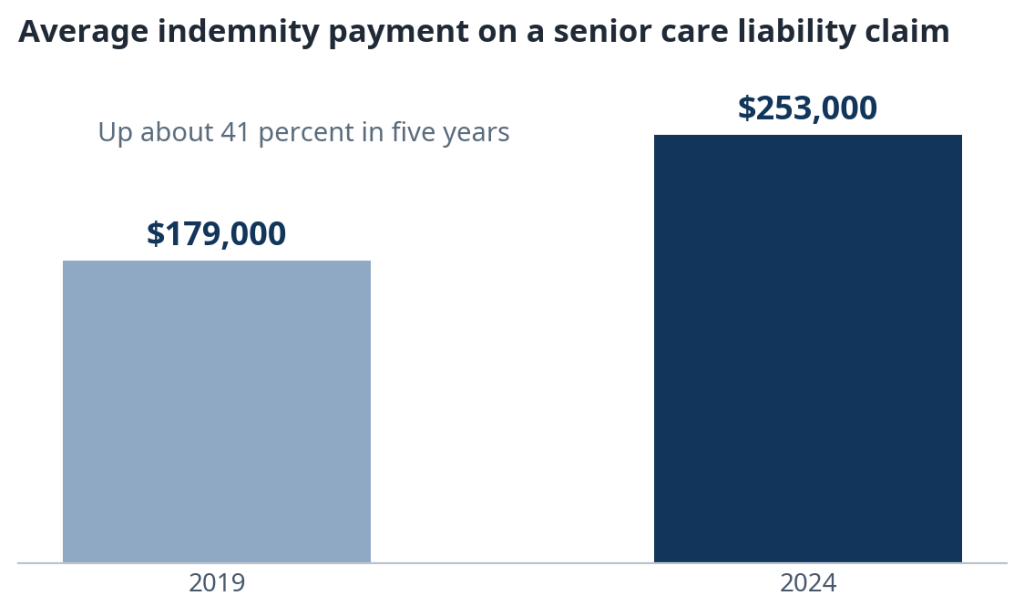
Senior living insurance costs are being set by two numbers most operators never see: the severity of claims against communities like theirs, and the age of the buildings they run. This report puts both numbers on the table. In 2024, the average indemnity payment on a senior care liability claim reached $253,000, up about 41 percent in five years, and claim severity is compounding at about 10 percent a year. At the same time, the average senior housing property in the United States is 24 years old, and the industry is building roughly 10,000 new units a year against a stock where about 45 percent of properties are already 25 years or older. The result is a market where most operators are priced on industry averages and class rates rather than their own record. This report lays out the figures, what is driving them, and what an operator can do in the 120 days before renewal to be priced on their own risk instead.
Download the full report (PDF)
Key findings
1. The average senior care liability claim now pays $253,000. That is the average indemnity payment for 2024, up from $179,000 in 2019. A 41 percent rise in five years is not inflation noise. It is the price of every renewal in this sector, whether the operator had a claim or not.
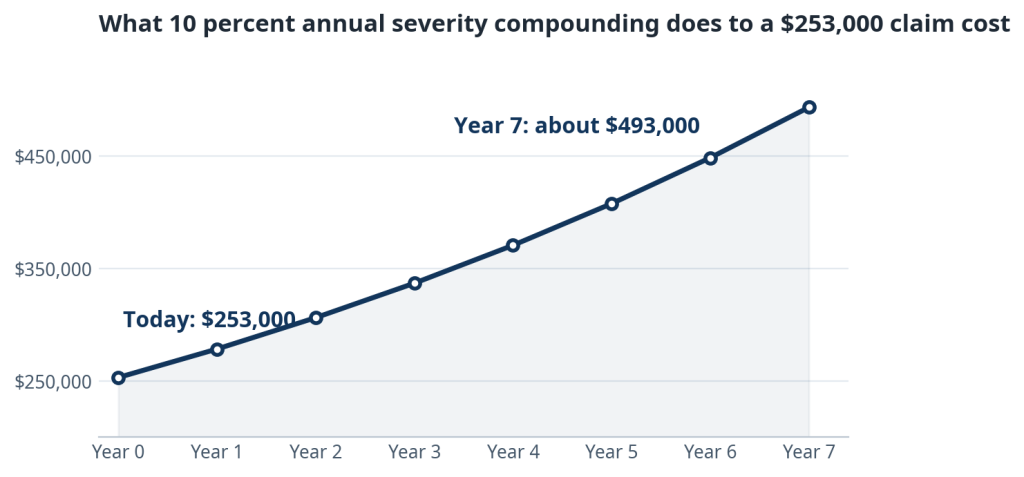
2. Severity is compounding at about 10 percent a year. At that rate, the cost of a serious claim doubles roughly every seven years. An operator whose limits, reserves thinking, and risk program are calibrated to 2019 claim values is underwriting a different business than the one they run today.
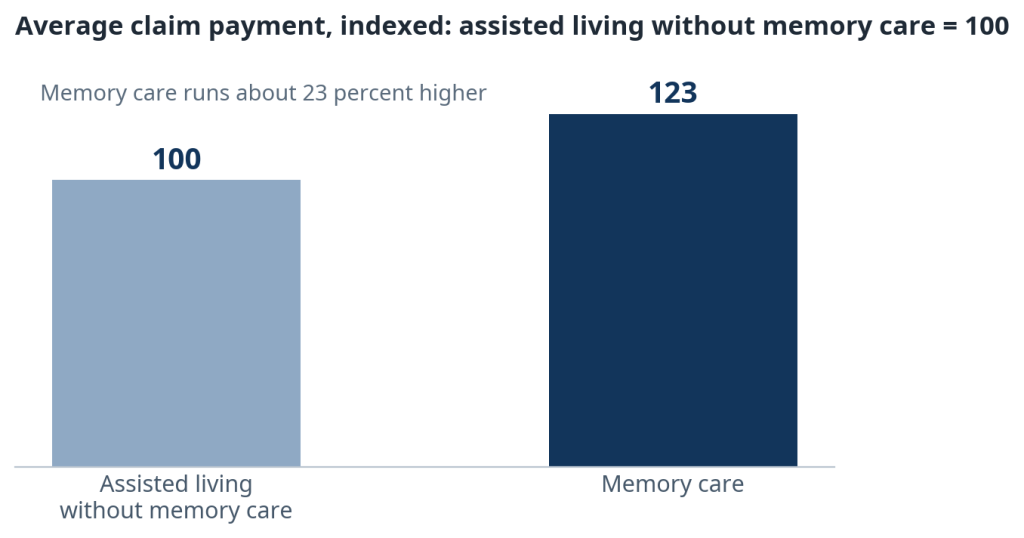
3. Memory care claims run about 23 percent above assisted living. The average memory care indemnity payment is $233,000, roughly 23 percent higher than assisted living without memory care. Acuity, elopement risk, and family expectations all price into that gap. Communities adding memory care capacity without repricing their risk are adding their most expensive exposure at their old rate.
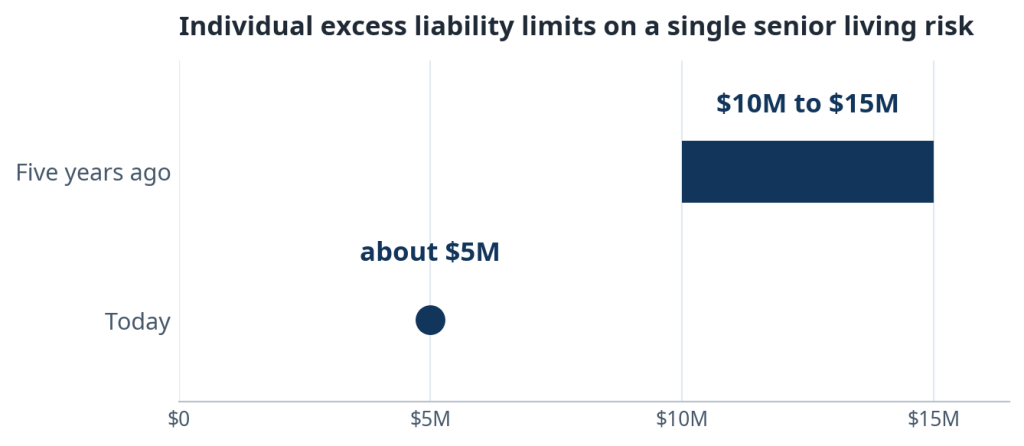
4. The excess market has repriced and shrunk at the same time. Excess liability renewal increases of 30 percent or more are now common, and the individual excess limits carriers will put on a single senior living risk have come down from the $10 million to $15 million range to about $5 million. Operators are paying more for less limit, and rebuilding a tower takes more carriers, more negotiation, and more lead time than it did five years ago.
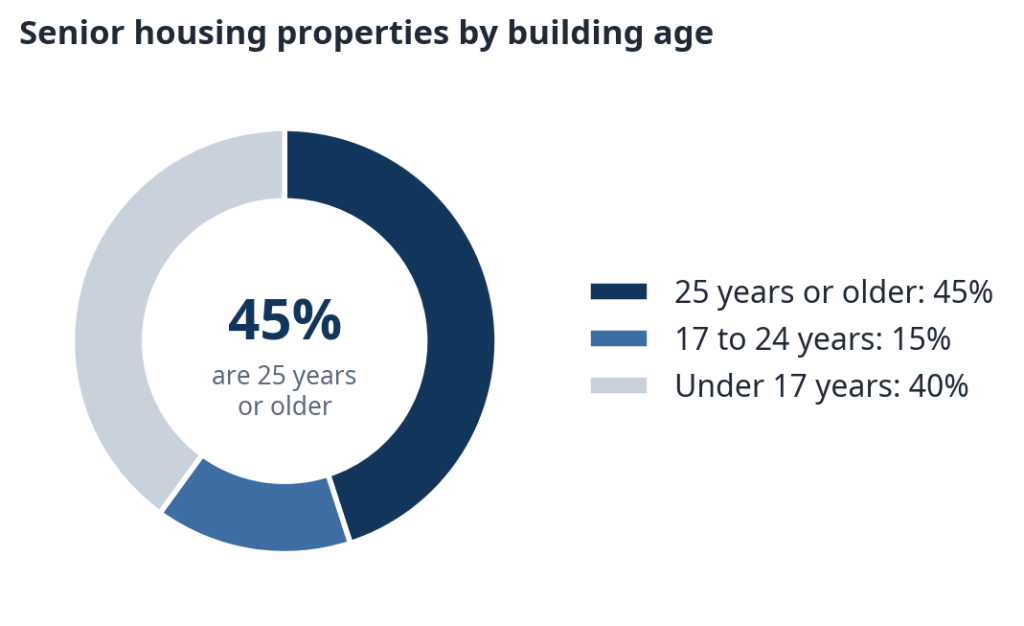
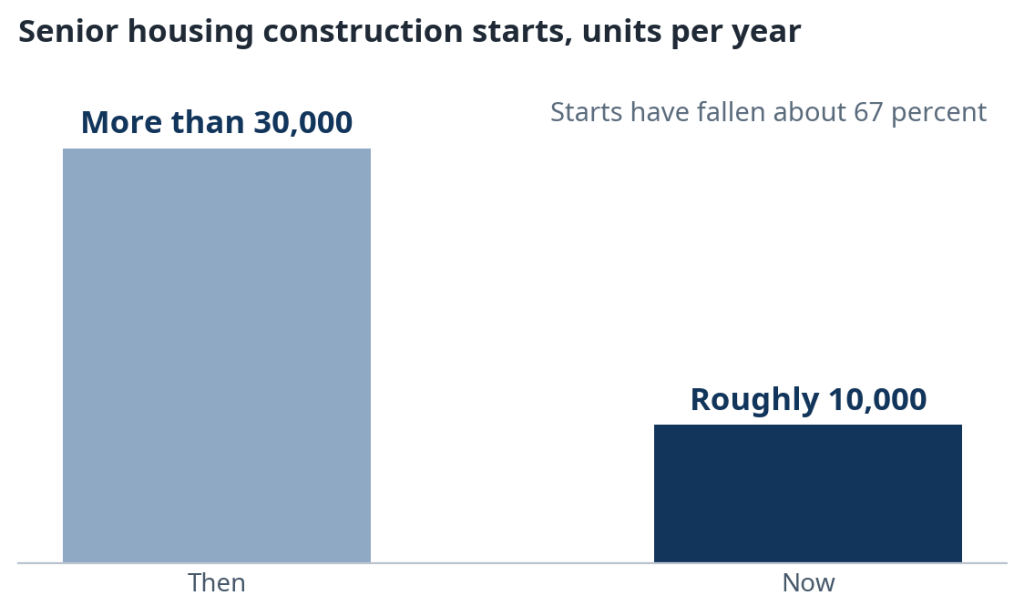
5. The average senior housing property is 24 years old, and about 45 percent are 25 or older. New construction starts have fallen from more than 30,000 units a year to roughly 10,000. The stock is aging faster than it is being replaced, so most operators will insure older buildings for the rest of their careers. Property pricing now turns on how well an older building is documented and maintained, not on its age alone.
6. Rebuild costs have outrun the limits on many property policies. Current senior housing construction costs run from about $281 to $358 per square foot for assisted living, with a national average near $364 per square foot across care types. A building insured to a pre-2020 valuation can be short millions against replacement cost, and coinsurance clauses turn that gap into a penalty on even a partial loss.
7. Most operators are priced on the class, not on their community. Underwriters see a submission, a loss history, and a set of class assumptions. Where the file is thin, the class rate fills the gap. The spread between the best-documented and worst-documented operators in the same class is where the money is, and it is decided in the months before renewal, not at the negotiating table.
Carriers price the class, not the community.
Section 1: Liability severity is the market
Every line of a senior living insurance program is downstream of one trend: claims keep getting more expensive, faster than premiums adjust.
The average indemnity payment on a senior care claim was $179,000 in 2019. By 2024 it was $253,000. That is a rise of about 41 percent in five years, and the underlying severity trend is compounding at roughly 10 percent a year. Fees and defense costs sit on top of indemnity, so the full cost of a serious claim rises faster than the headline figure.
Three forces drive the trend. Juries and settlement expectations have reset higher for care failures involving vulnerable residents. Acuity keeps climbing, as residents arrive older, sicker, and with more conditions than a decade ago. And plaintiff firms have industrialized: the same allegations, the same experts, and the same playbook, run community by community across the country.
Memory care is where severity concentrates. The average memory care indemnity payment of $233,000 runs about 23 percent above assisted living without memory care. That gap is structural. Memory care residents cannot reliably report harm, wander risk is constant, and families litigate grief as well as injury. An operator expanding memory care is expanding their highest-severity exposure, and the insurance program should be rebuilt at the same time as the wing.
What this means at renewal: the carrier is not pricing the operator’s intentions. It is pricing a severity curve that rises 10 percent a year, applied to the operator’s own loss history and whatever the submission proves or fails to prove about how the community runs.
Section 2: The excess market: more money, less limit
Excess liability is the clearest example of the new arithmetic. Five years ago, a clean senior living risk could buy an individual excess limit in the $10 million to $15 million range without unusual effort. Today, individual excess limits around $5 million are the working reality, and renewal increases of 30 percent or more are common even for operators without a recent severe claim.
Two things changed. Carriers paid the severity curve described in Section 1, and several decided their prior limits were underpriced for the verdicts now being returned. And capacity concentrated: fewer carriers willing to write the layer means each one can name its price and its limit.
For operators, the practical consequences are these:
- A limit tower that took one or two carriers now takes several, and each additional carrier is a separate underwriting of the same community.
- Lead time is part of the price. A tower assembled in the last 30 days before renewal costs more than the same tower built over 120 days.
- A single severe claim now reaches higher into the tower. Limits that once looked like cat insurance are working limits, and adequacy should be tested against a $253,000 average that is compounding, not against the claim sizes of a decade ago.
Section 3: Property and the aging building stock
The liability fight gets the attention. The property fight is decided by arithmetic.
The average senior housing property in the United States is 24 years old. About 60 percent of communities are at least 17 years old, and about 45 percent are 25 years or older. Construction starts have fallen about 67 percent, from more than 30,000 units a year to roughly 10,000 units in 2025. At that pace, the industry will run today’s buildings for a long time.
Meanwhile, the cost of replacing those buildings has reset. Industry construction surveys put 2026 senior housing development cost at an average of about $364 per square foot, and mid-range construction costs at about $281 to $358 per square foot for assisted living and $318 to $376 for skilled nursing. Run that against a real building: an 80,000 square foot assisted living community at $340 per square foot costs $27.2 million to replace. If it is still insured at $20 million because the valuation predates the pandemic, the operator is quietly self-insuring $7.2 million, and an 80 percent coinsurance clause means the carrier pays only about 92 percent of even a partial loss. On a $2 million water loss, that valuation gap alone costs the operator roughly $187,000.
For older buildings, the rate is rarely the real fight. The fight is insurability, valuation, deductibles, and the gaps that show up after a loss. Underwriters read five files on an older building: the roof file, the systems file (electrical, plumbing, HVAC), the water file, the life safety file, and the ordinance or law file. The year a building was built cannot change. Nearly everything in those five files can, and documented maintenance reads to an underwriter as a managed asset while missing records read as a claim waiting for a storm.

Two numbers deserve a hard look before binding. Percentage deductibles: a 2 percent wind deductible on a $27.2 million building is $544,000 out of pocket before the carrier pays anything. And business income with extra expense: a senior living community cannot send its residents home and reopen next quarter, so relocation and continuity costs after a loss are an operating risk, not a footnote, and the limit should be tested against a 12 to 18 month restoration of the oldest building in the portfolio.
Echo’s read of the 2027 property market for senior living is essentially stable. Stable is not the same as easy. Catastrophe-exposed risks face probable maximum loss studies and heavy scrutiny, and smaller accounts are already seeing deductible increases. In a stable market, the complete file is the negotiation.
Section 4: What to do in the 120 days before renewal
Severity, the excess market, and building age are market conditions. The operator’s price inside those conditions is set by the file they bring. This is the work, in the order underwriters read it.
Days 120 to 90: get the numbers right.
- Commission a fresh replacement cost valuation for every building over 20 years old, and reconcile the policy limit to it in writing.
- Pull three to five years of loss runs and read them the way an underwriter will. Know which claims are open, what is reserved, and what the narrative is before anyone asks.
- Convert every deductible on the current program to dollars, per building, and confirm the largest one is a number the balance sheet can carry on its worst day.
Days 90 to 60: build the proof.
- Build the roof and systems file: replacement dates, materials, invoices, inspection reports, and photos, one folder per building.
- Document water controls: automatic shutoff valves, leak sensors, the written response plan, and test logs. If controls are missing, get a priced proposal and put it in the submission as a committed plan.
- Assemble the life safety file: sprinkler, alarm, emergency power, and kitchen suppression test records, with every deficiency and its correction in the same folder.
- Recheck ordinance or law limits against the age of each building and current local code.
Days 60 to 30: fix the story.
- Write the submission narrative around how the community actually runs: staffing model, acuity management, incident review, and what changed after the last claim. This is the perception gap work: the distance between how the file reads and how the community operates is premium paid for nothing.
- Test liability limits against today’s severity curve, not last decade’s verdicts, and start the excess tower early enough to add carriers if limits need rebuilding.
- Stress test business income and extra expense against a 12 to 18 month restoration of the oldest building, including resident relocation cost.
Days 30 to 0: negotiate from the file.
- Make the underwriter’s internal case easy. Carriers compete for risks they can defend to their own management. A complete file is a risk an underwriter can win with.
- Bind with time to spare. Programs bound under deadline pressure keep the errors of the old program and add new ones.
Make the underwriter’s internal case easy.
Methodology and sources
This first edition of the Benchmark Report is built from published market and claims data that Echo Assurance tracks as part of its advisory work, read and interpreted by Echo. It does not draw on Echo’s client book, and no figure in this edition comes from an individual client’s program.
Principal sources: published senior care claims and severity studies covering indemnity payments through 2024; published senior housing data on property age and construction starts; published 2026 senior housing construction cost surveys; and Echo Assurance’s published analyses of the senior living property and liability markets, available in Echo Assurance Insights at echoassurance.com. Where an example uses round numbers, such as the coinsurance calculation in Section 3, it is illustrative arithmetic and is labeled as such in Echo’s underlying article.
Future editions are planned to incorporate aggregated, anonymized data from Echo Assurance placements, with the methodology updated to say so when they do.
Averages are expensive for the operators above them.
About Echo Assurance
Echo Assurance is a senior living risk and capital advisor. We work with senior living owners and operators across the United States on insurance strategy: how risk is perceived by the market, what it actually costs, and how to capture the difference.
Our methodology is Capital Advantage. The roadmap is the Capital Freedom Blueprint, in three phases. REVEAL: find the gap between how underwriters see a community and how it actually runs. QUANTIFY: put a dollar figure on what that gap and the community’s real risk cost over time. CAPTURE: rebuild the program, the submission, and the renewal around the community’s own numbers, so the operator is priced on their risk, not the industry’s.
This report exists because the industry runs on averages, and averages are expensive for the operators above them. The severity curve, the excess market, and the age of the building stock are the same for everyone. The file an operator builds in the 120 days before renewal is not.
Download the full report (PDF)
How to cite this report: Echo Assurance. Senior Living Insurance Benchmark Report, 2026 Edition. Echo Assurance, 2026. echoassurance.com. Figures may be quoted with attribution to Echo Assurance and the edition year.